Reports
Reports aggregate many test runs into a single view. Where View result shows you one conversation, a report lets you ask questions across a date range, scenario set, or label.
When to use a report
- Pass-rate trend. Did pass rate drop after this week’s deploy?
- Regression detection. Which paths started failing yesterday?
- Coverage gaps. Which scenarios haven’t been run lately?
- Slowest paths. Where is the target spending the most time per turn?
- Stakeholder summary. A weekly digest you can share via tokenized link.
Creating a report
- From the left nav click Reports.
- Click + New report (or Generate report depending on view).
- Pick a date range and the scenarios / labels to include.
- Save with a name. The report appears in the list and is computed in the background.
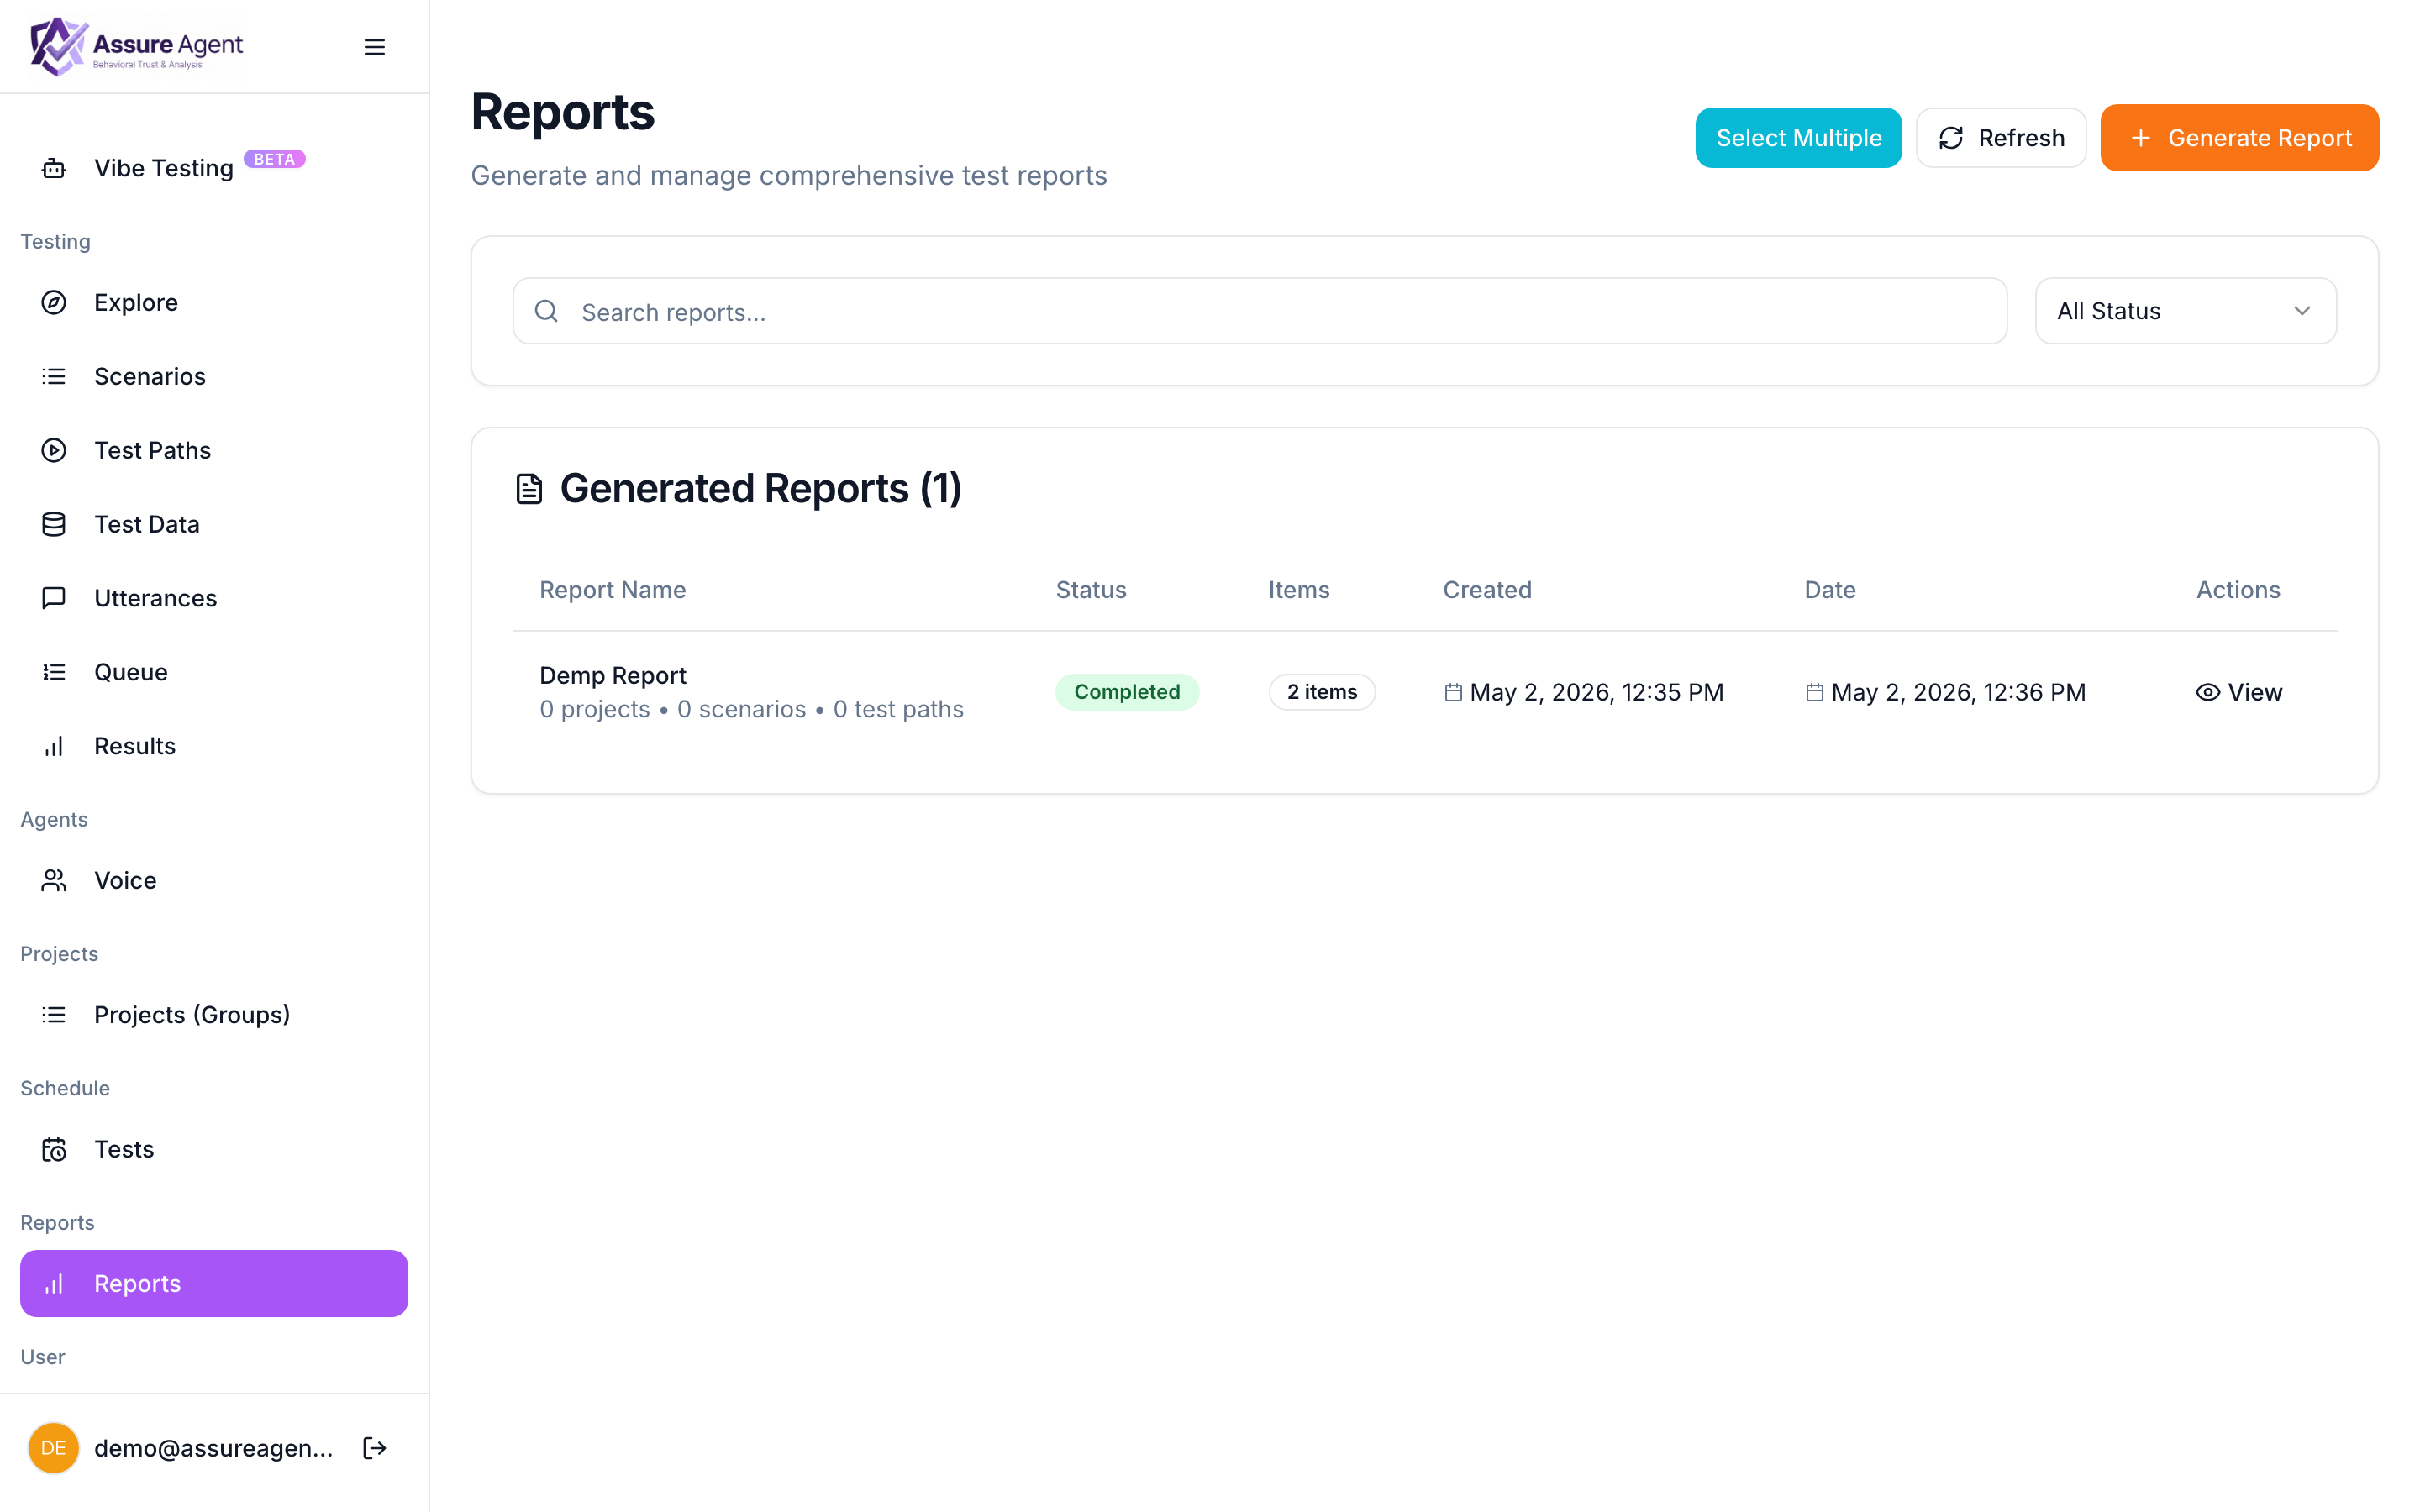
What’s in the list
Each row in the list shows:
- Name of the report.
- Status —
pendingwhile computing,completedwhen ready,failedon error. - Created at.
- Coverage summary — number of scenarios + runs included.
Click any row to open the Report viewer.
Refreshing
Reports are snapshots taken at generation time. To pick up new runs, regenerate from the same configuration — the new report is created alongside the old, so you can compare.